Upload Function Guide
Visualization Function Guide
Re-Visualization Function Guide
Result Files Download Guide
What is uploading ?
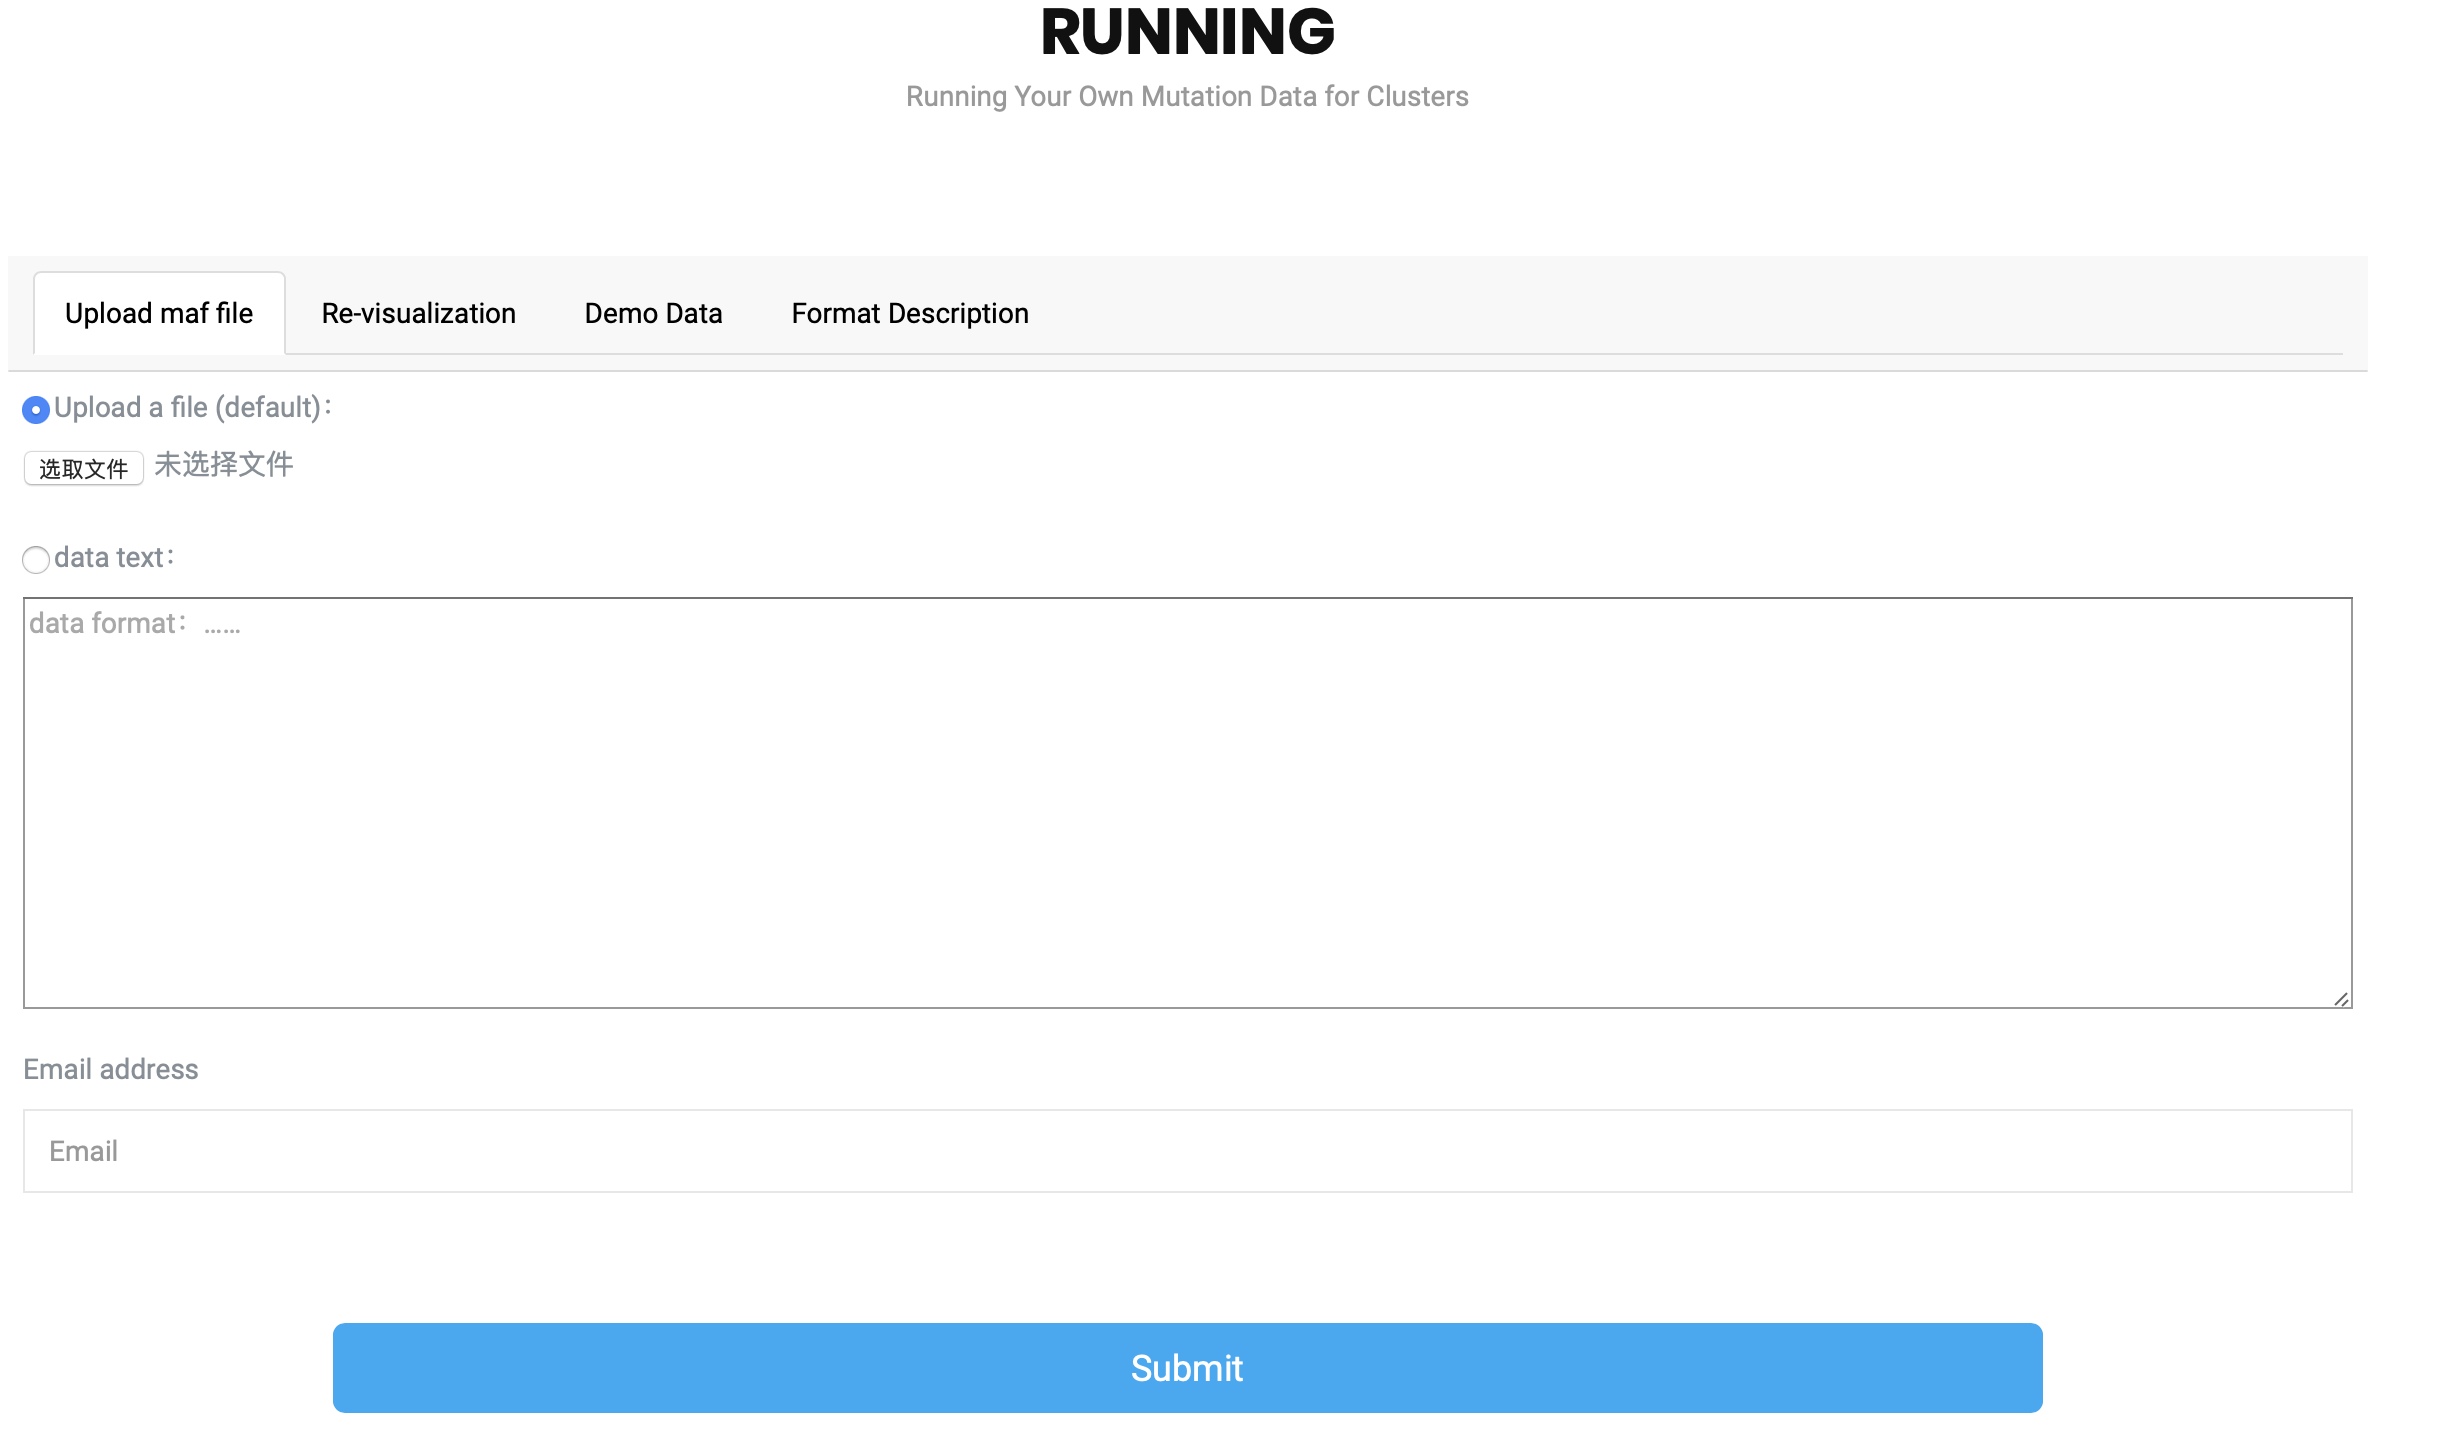
What format input file is required to run HotSpot3D?
The input file must contain 11 columns of data in the Format Description?
Can I change the column name?
If I haven't prepared the maf file yet, how should I use Hotspot3D?
Is the demo data consistent with the effect of running my own files?
Successfully running the software, but there has never been a result?
Must I waiting for result?
What is the meaning of the icons in different colors in the results page?
What is visualization?
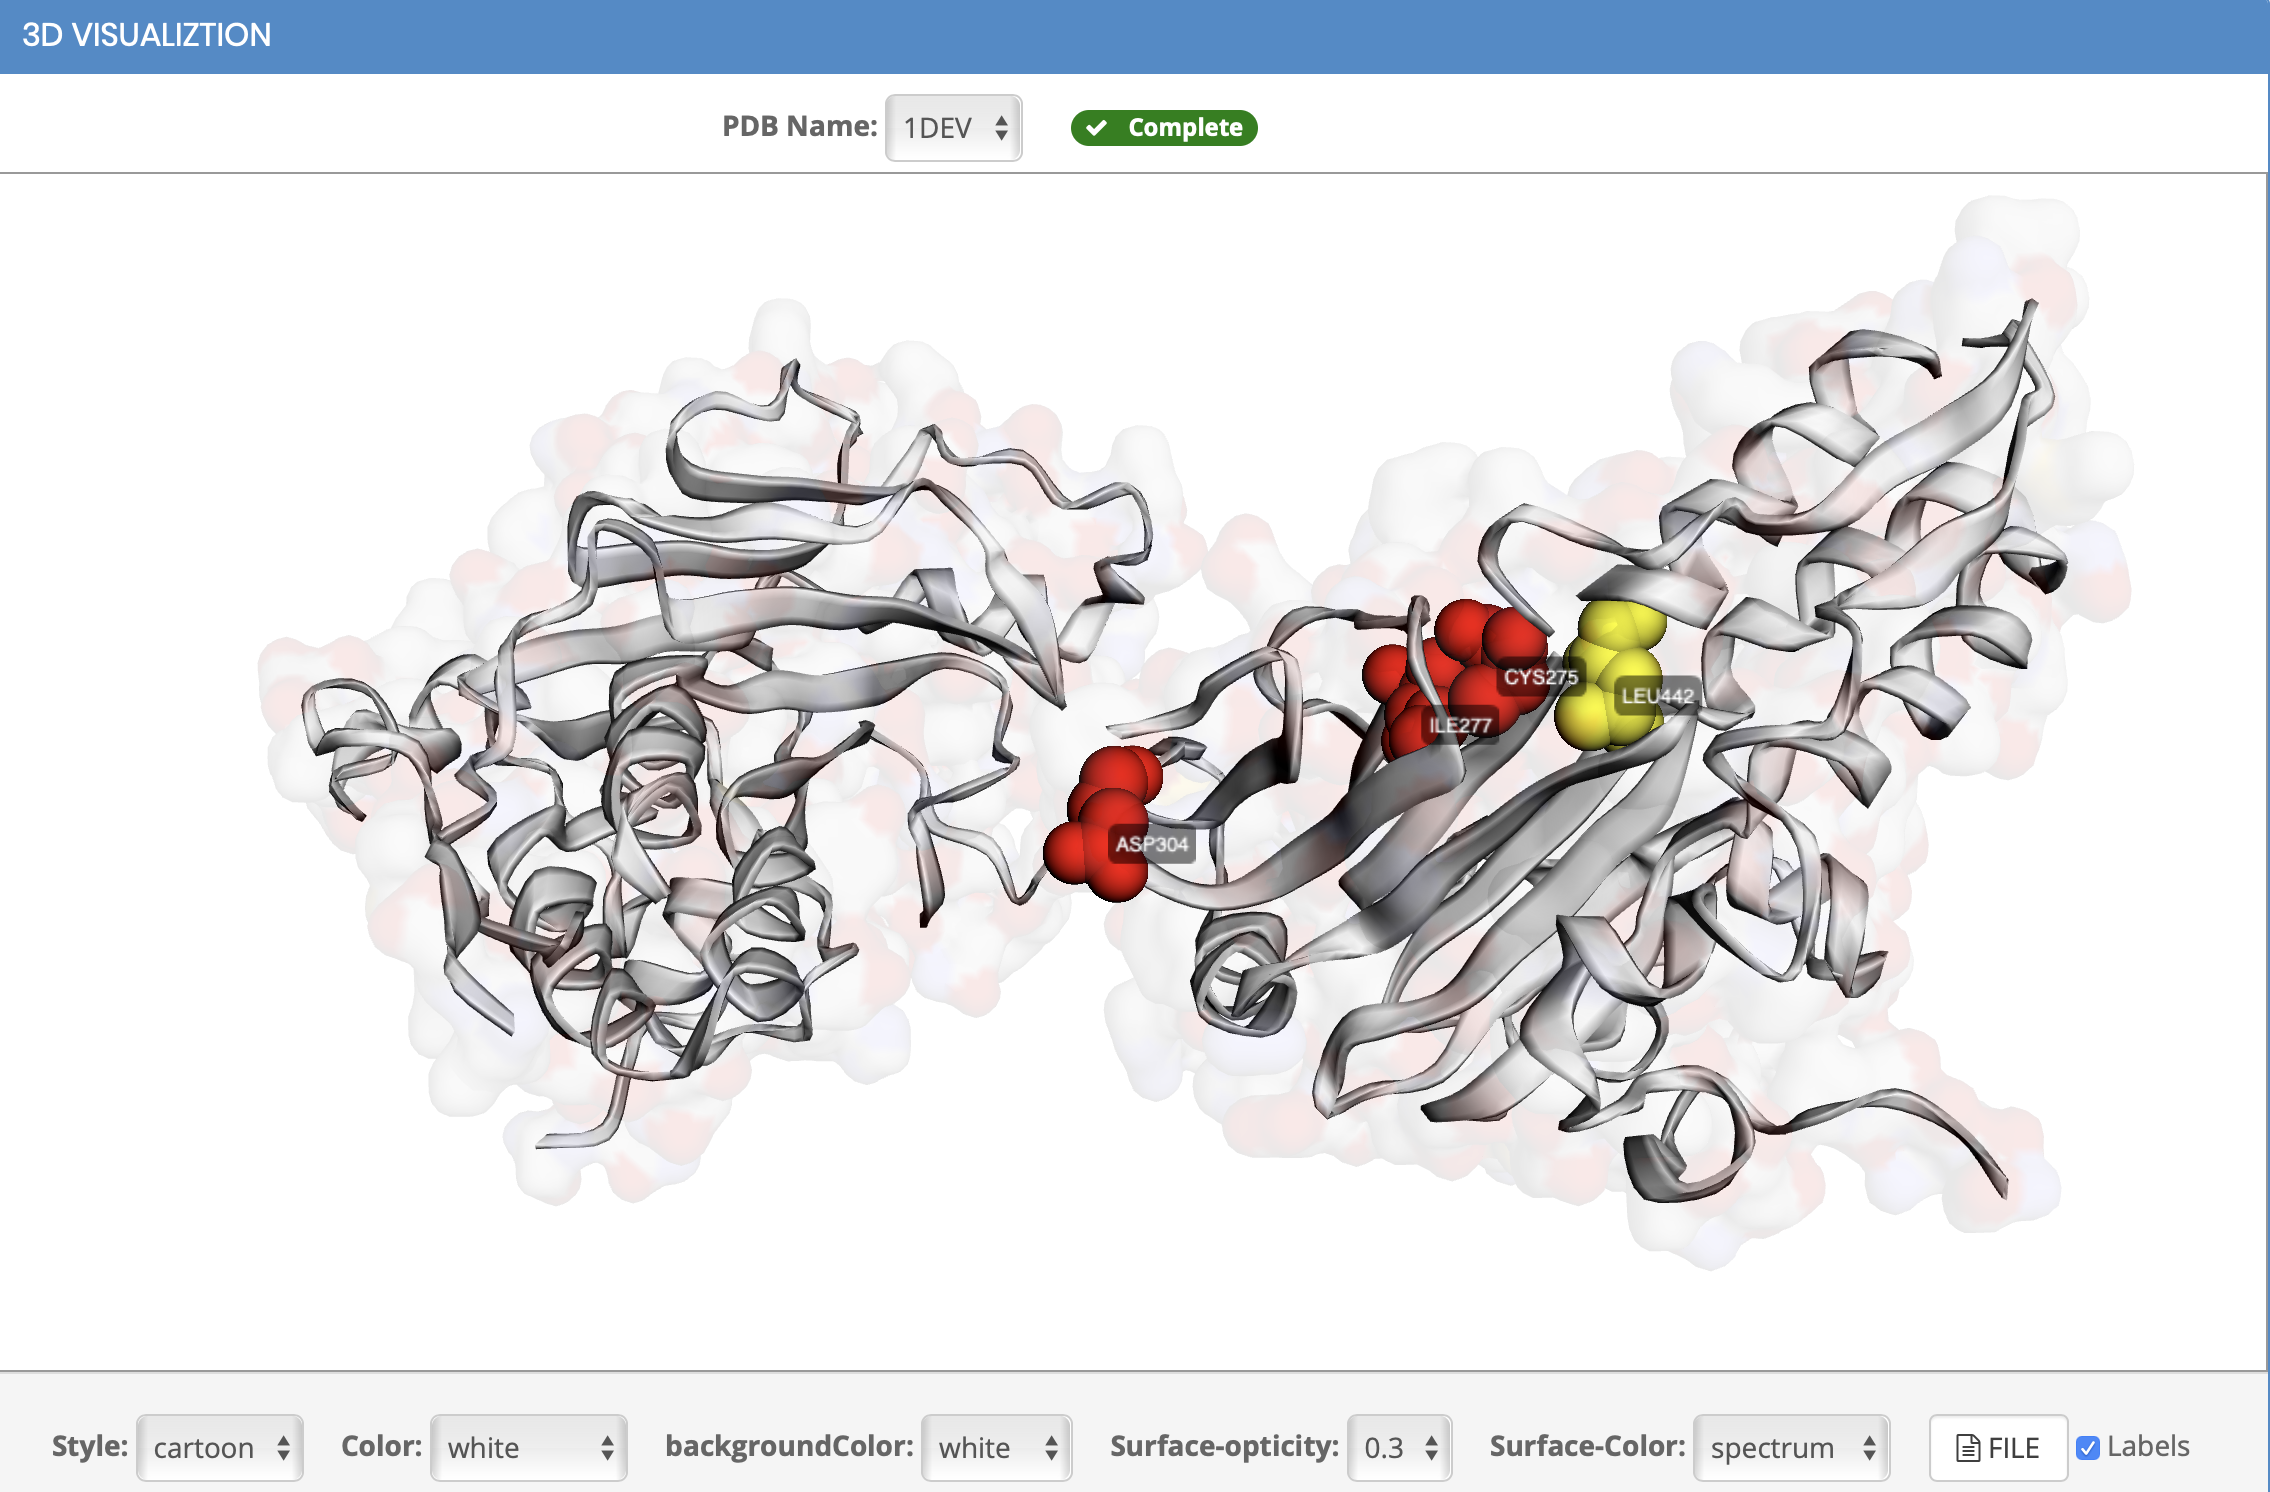
How to choose protein structure?

You can select the protein structure by clicking on the drop down list.(Try)

After selection, the visualization interface will automatically load the newly selected protein structure.

What is the source of the protein structure?

We used protein structure data from RSCB PDB.

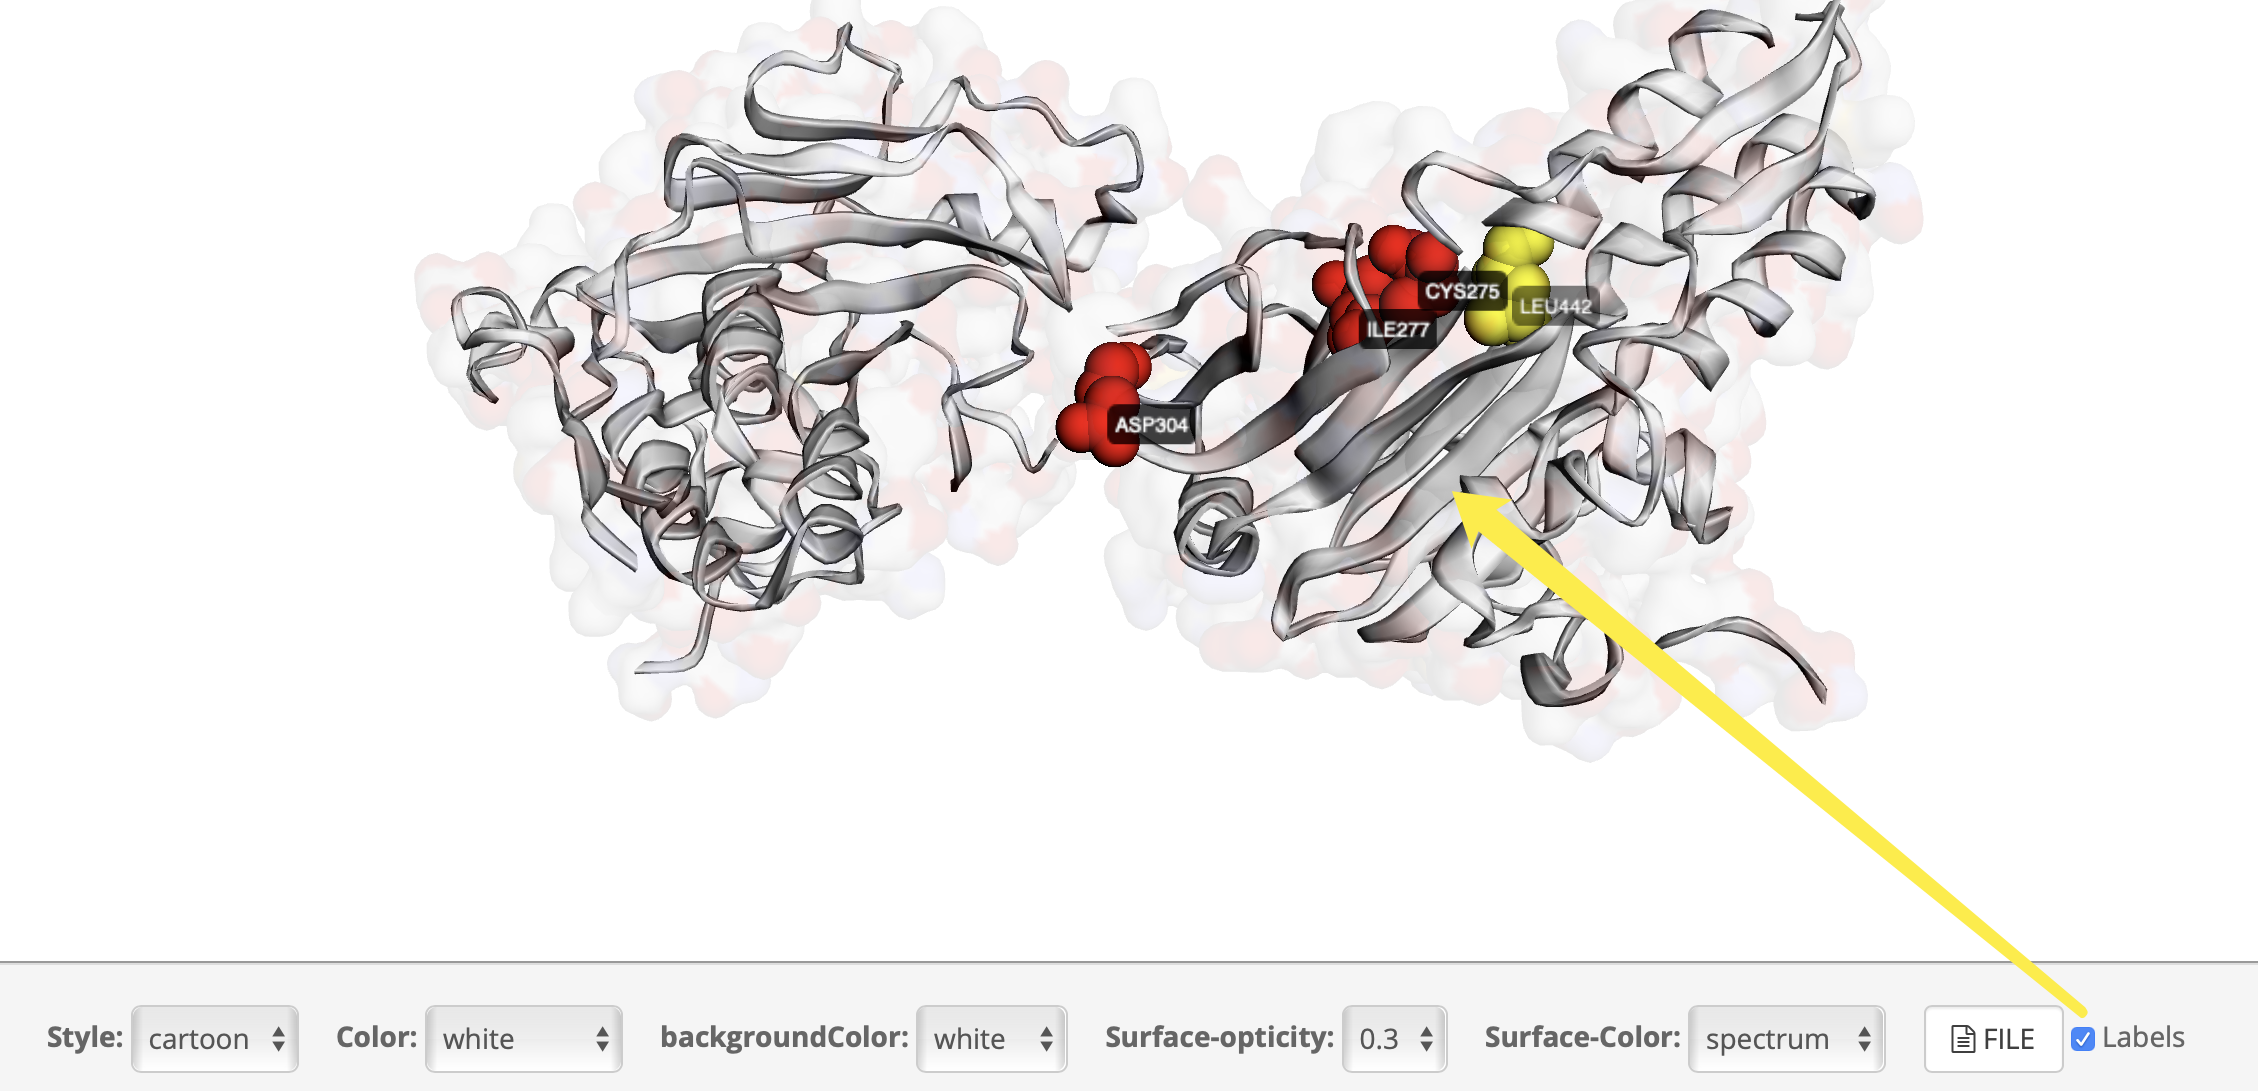
How to view the 3D structure?

The picture shows the visualization window we provide (Try):


We use the 3D structure plugin provided by 3Dmol, which provides powerful visualization capabilities.
You can place your mouse on the structure to rotate the angle and zoom in and out.

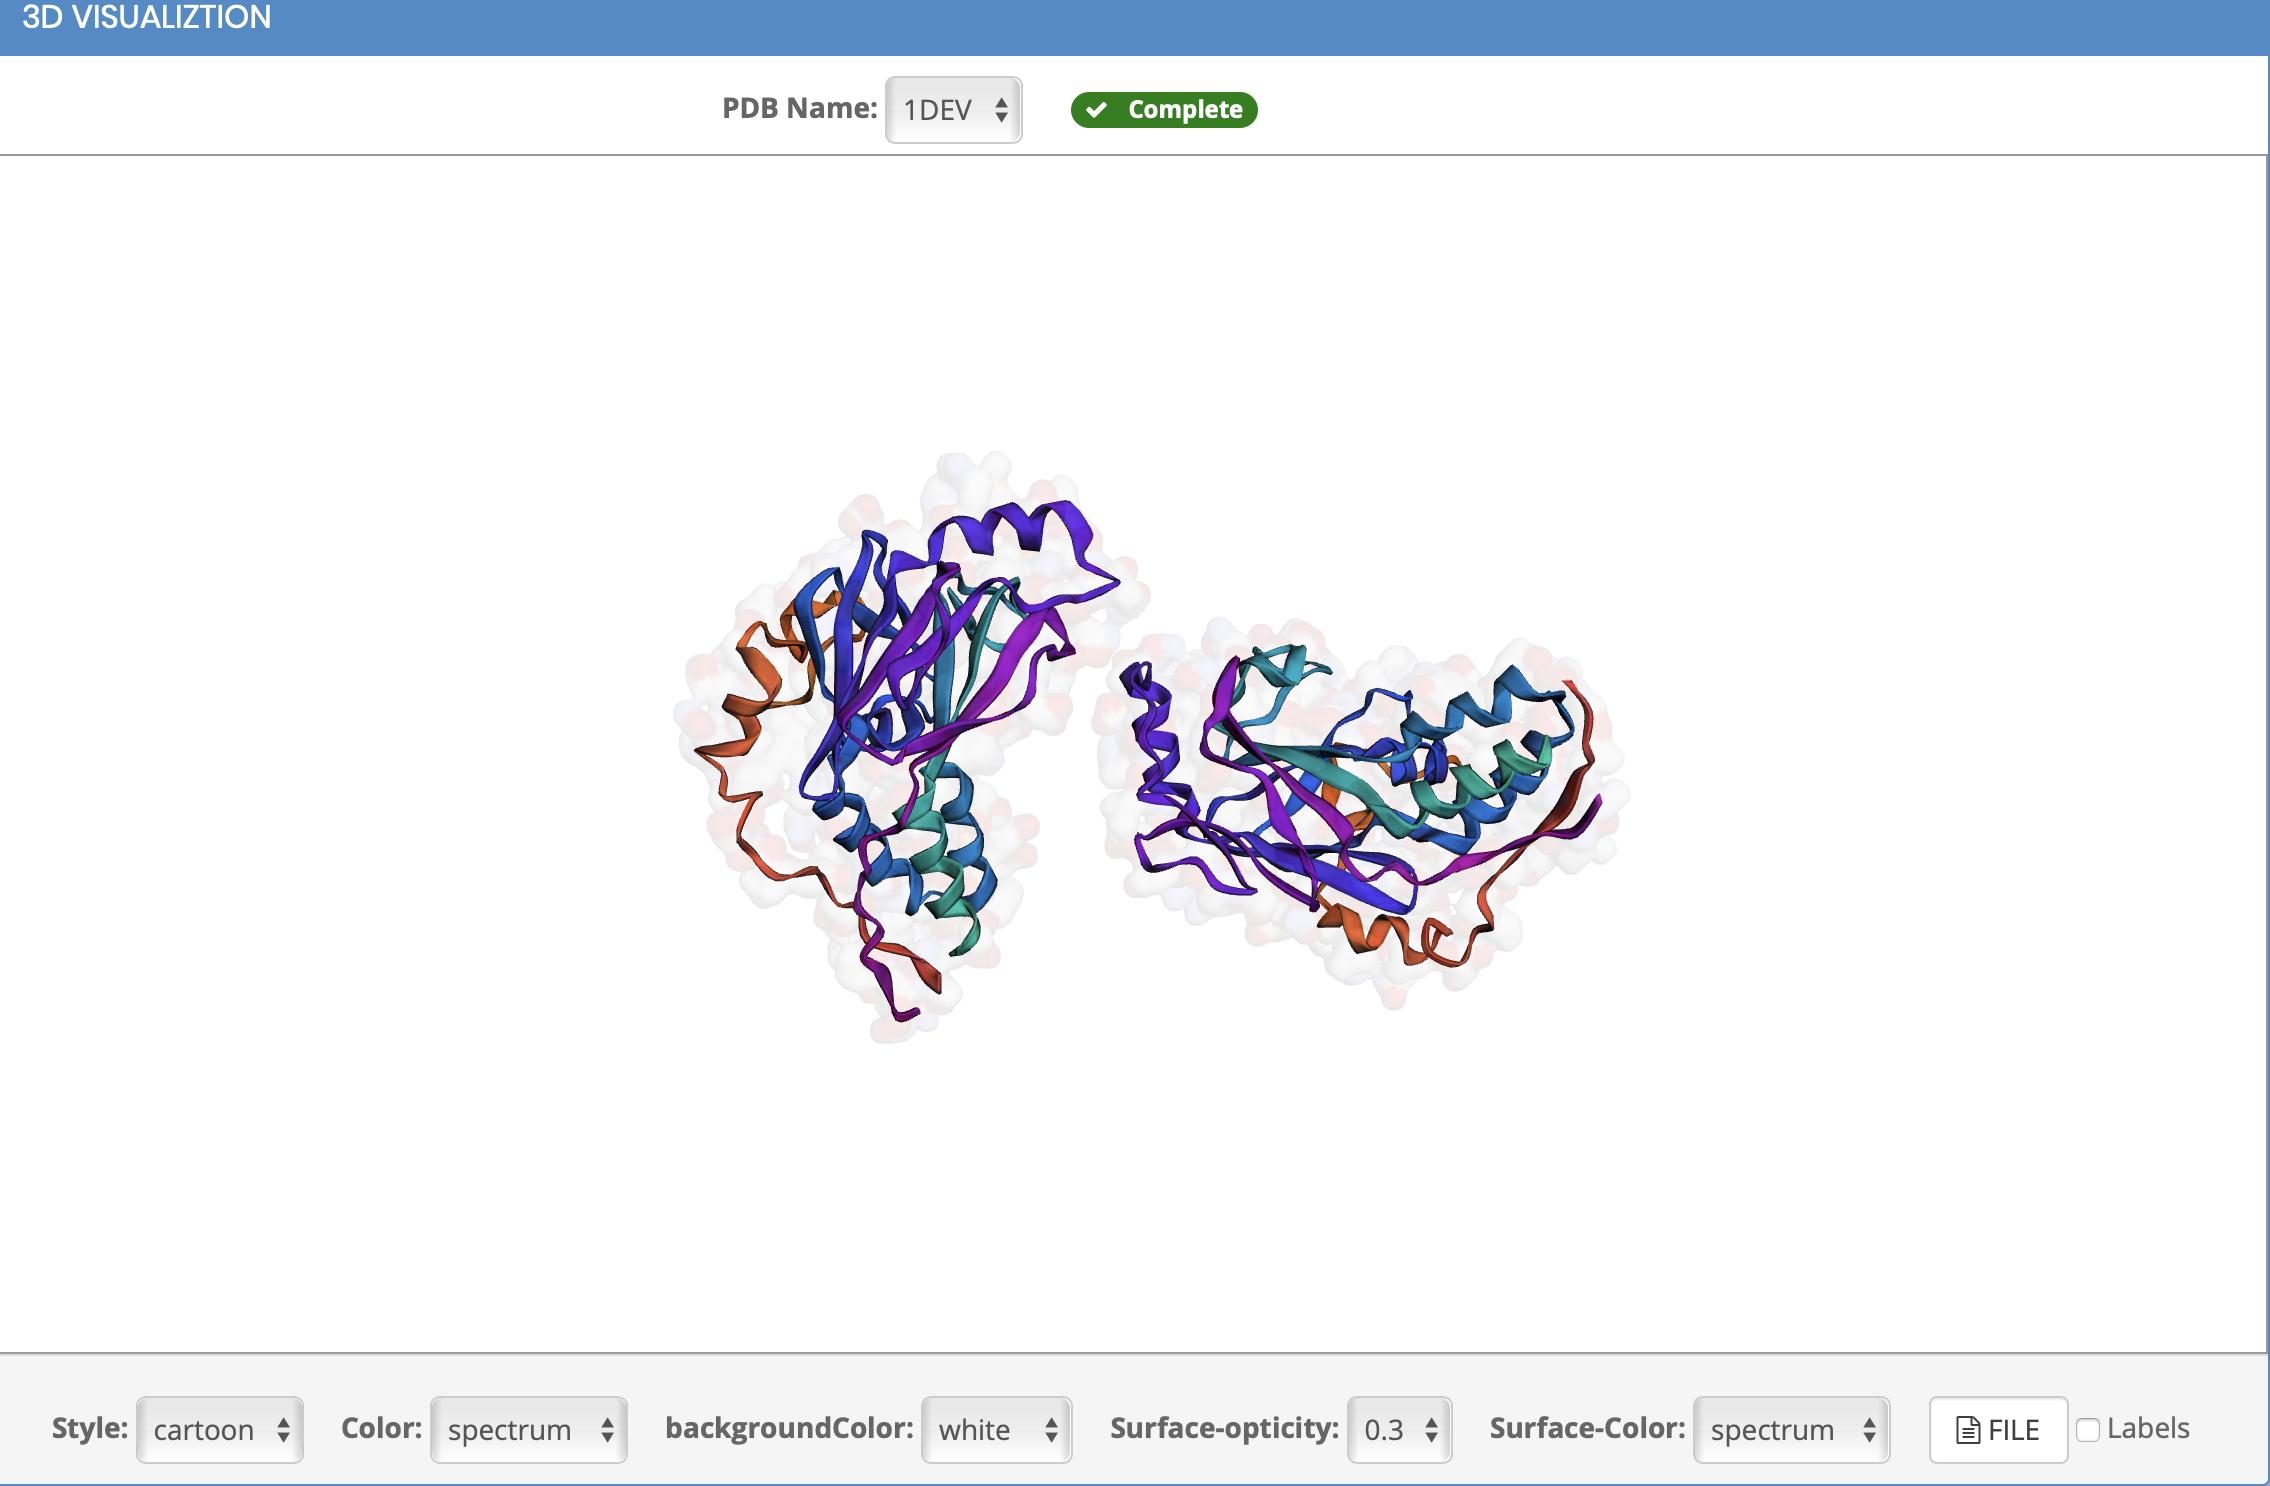
Can I customize the protein structure?
3Dmol provides a number of properties to choose from, and HotSpot3D allows you to modify the following properties:
  • Style: The overall structural style of the protein structure, including cartoon, line, stick, sphere, cross.
  • Color: The color of each chain of the protein structure, the default is the spectrum.
  • BackgroundColor: visible window background color.
  • Surface-opticity, Suface-color: transparency and color of the entire protein sueface, surface-opticity=0 means no surface.
How to display cluster results
    Click on the Label of the cluster you are going to project, then you can see this cluster on the protein structure.(Try)


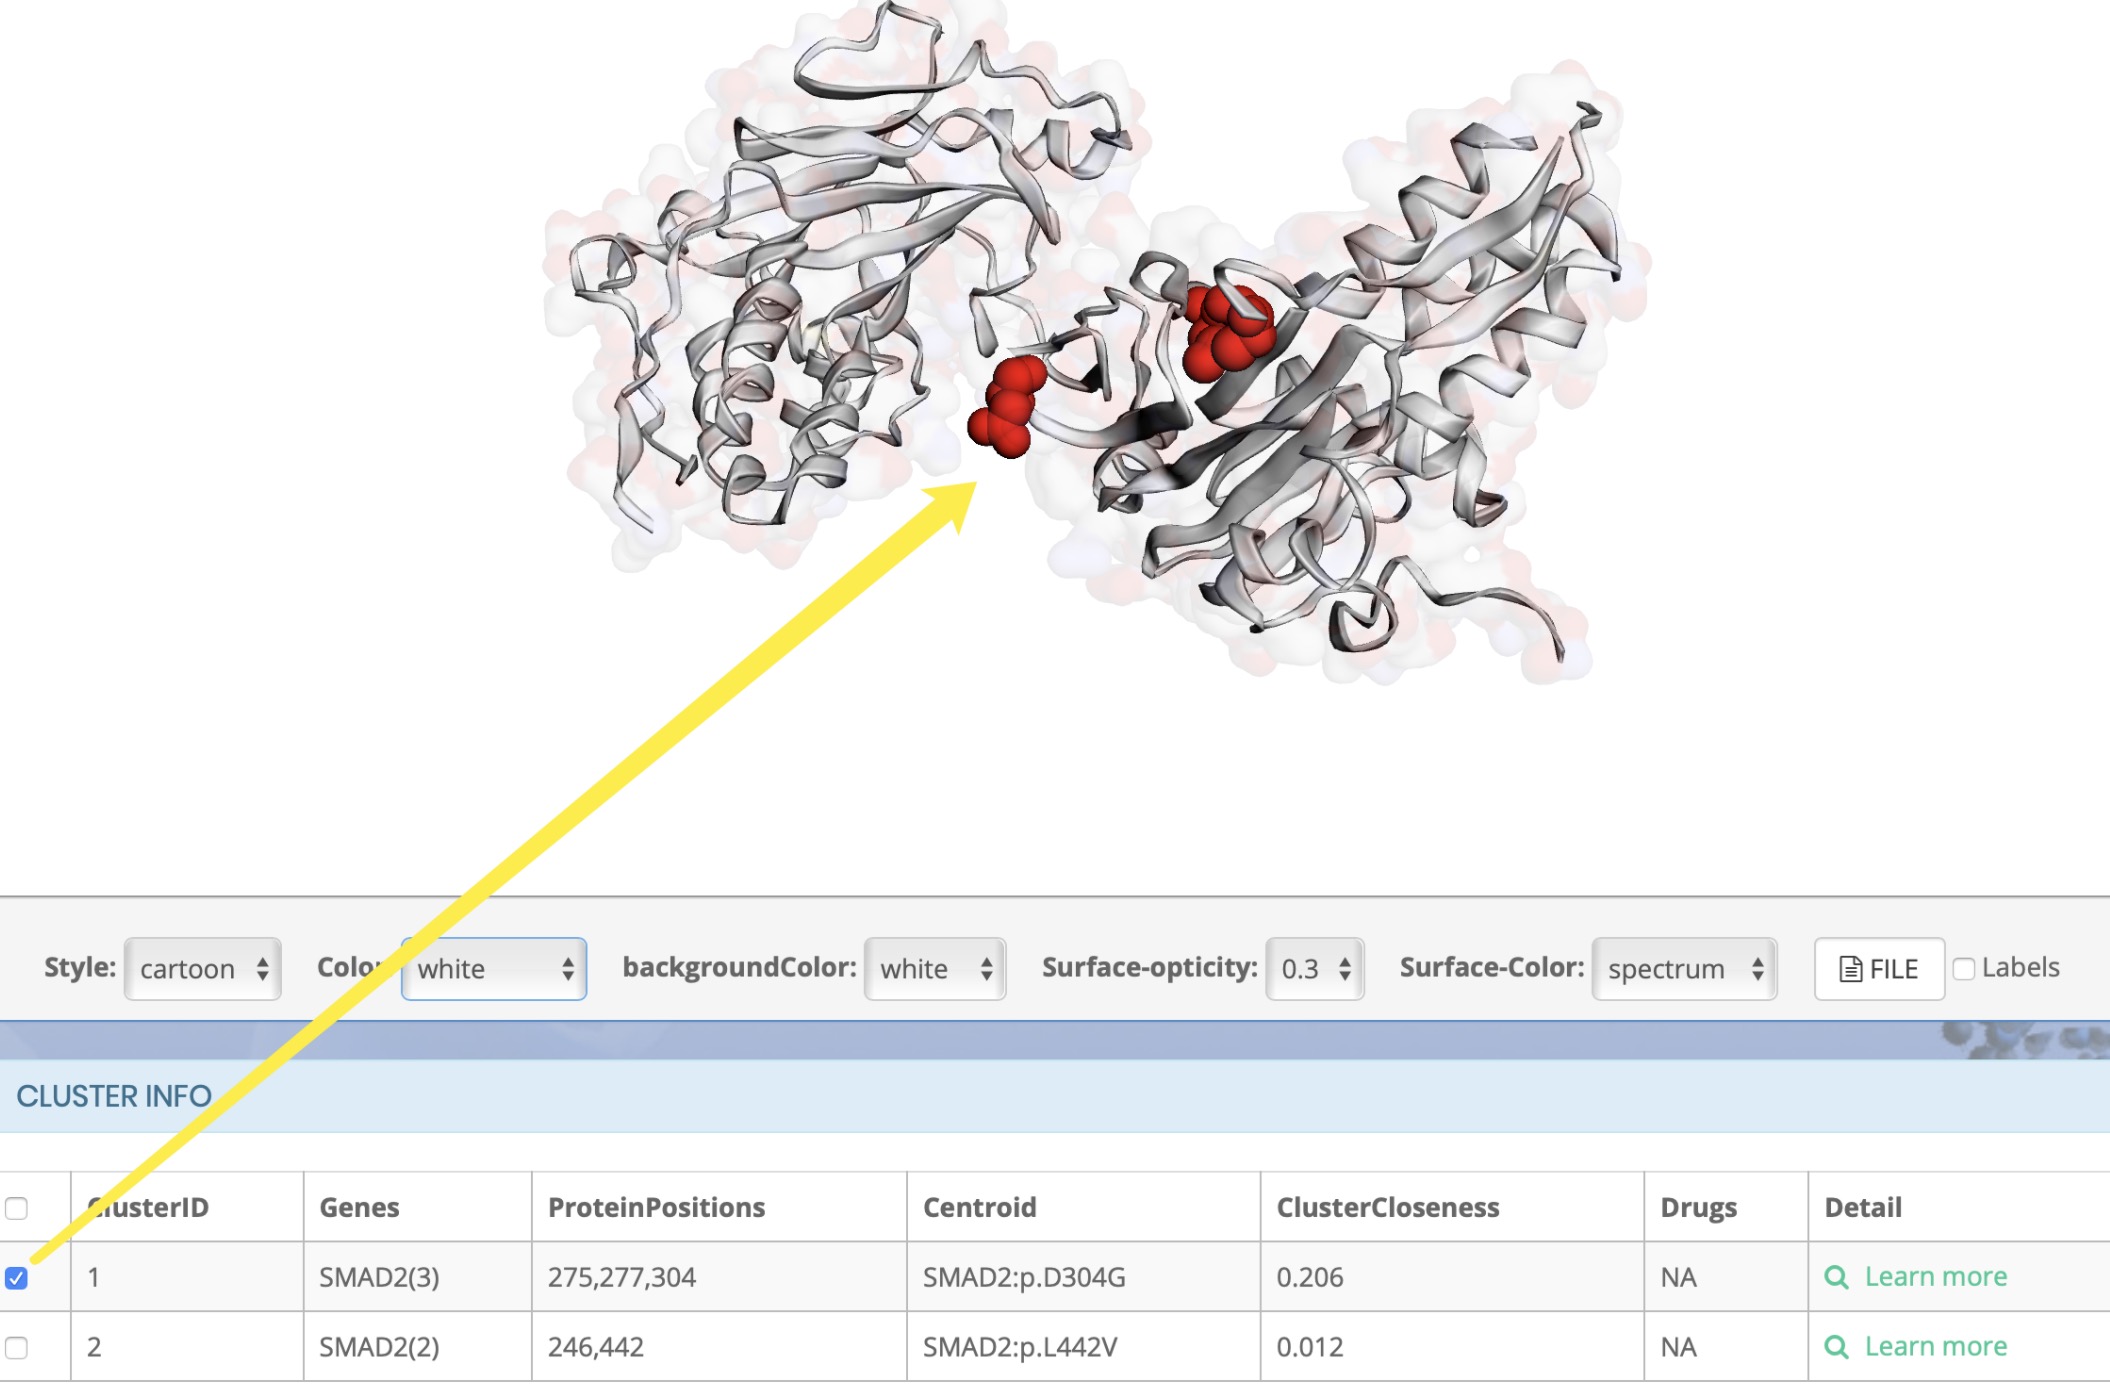
Why did the cluster appear on the protein structure after clicking?

The PDB structure you choose may not correspond to the cluster. This clustering result is based on other protein structures.

How to distinguish cluster?
  • When multiple clusters appear in the results, different clusters are displayed with different colors.
  • ou can click on "Label" to add a label to each cluster to distinguish(Try):

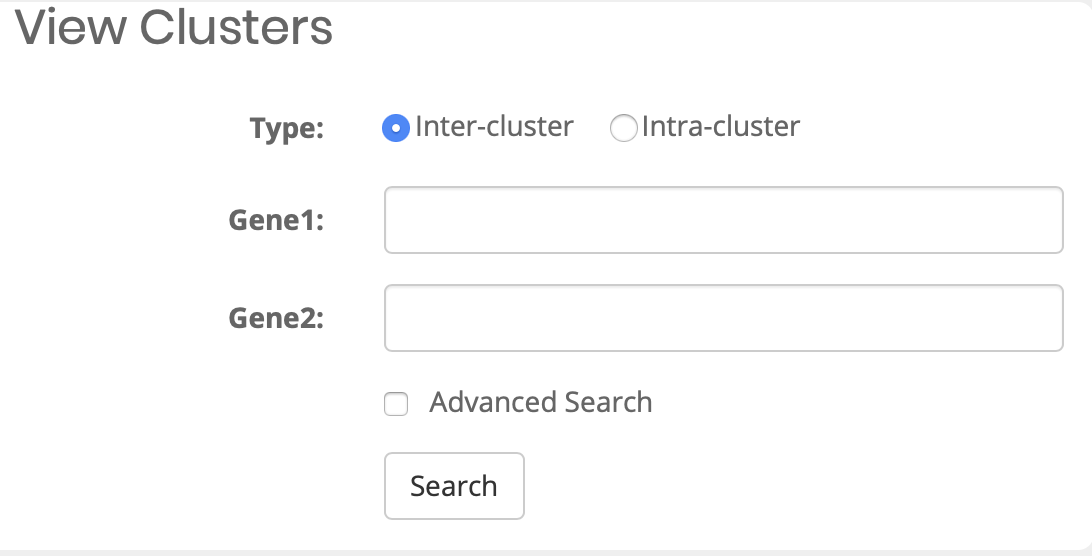
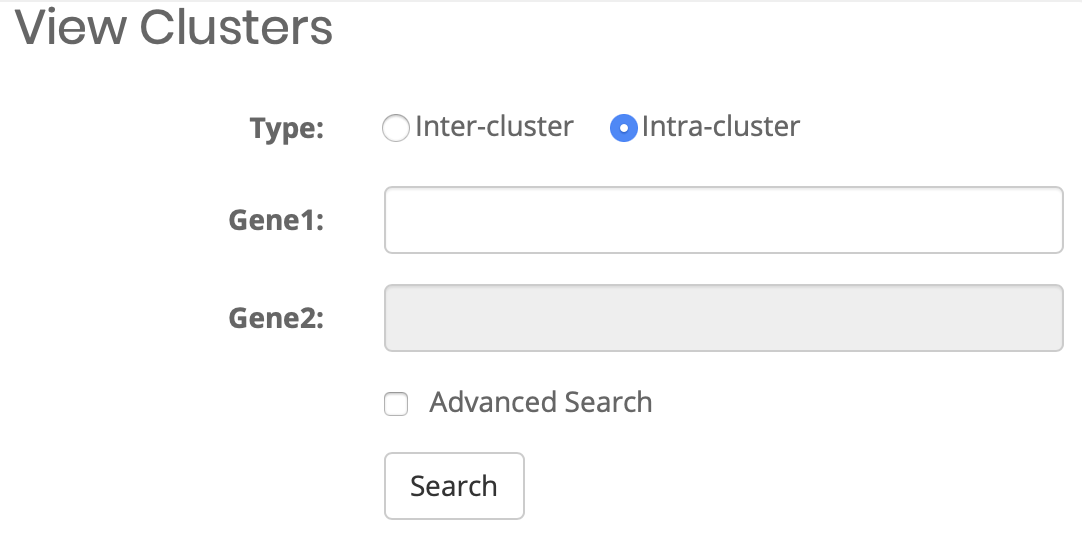
How to re-visualize?

The re-visualization function can be implemented by uploading summary and pairwise files, both of which come from the results of running with HOTSPOT3D software.

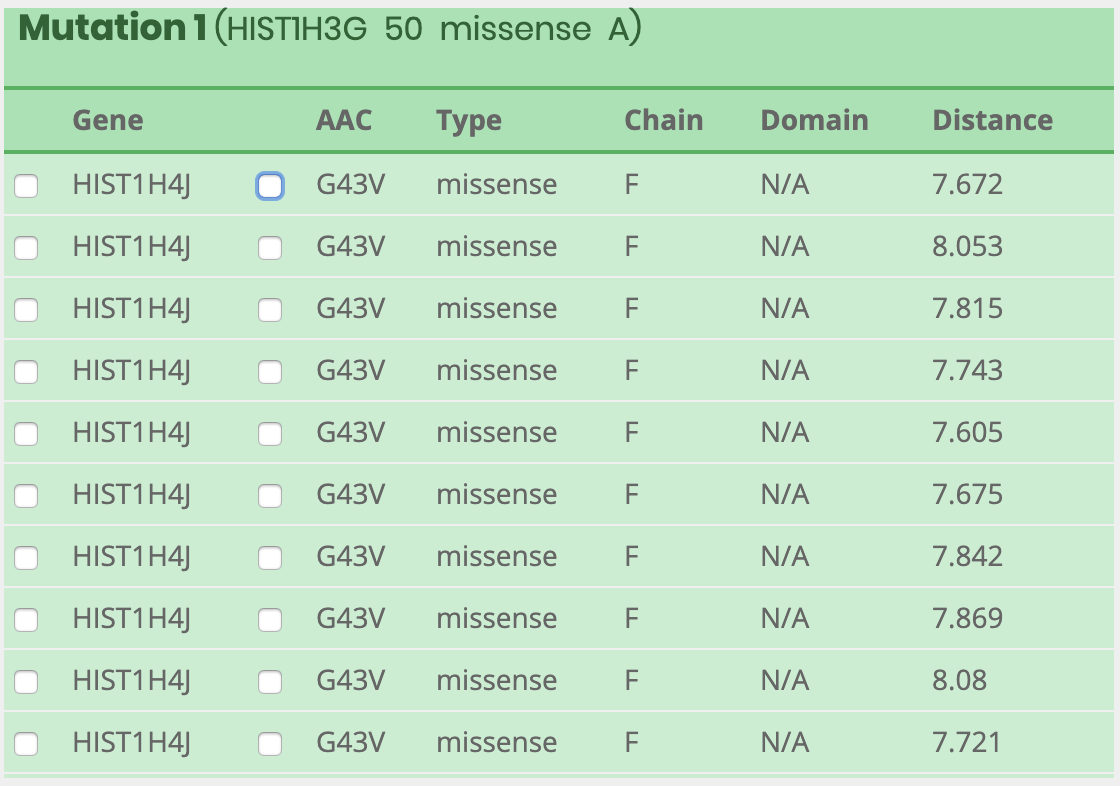
HOW TO GET SUMMARY AND PAIRWISE FILE ?
COULD I RE-VISULATION AFTER 24 HOURS ?
WHEN SHOULD I USE RE-VISISUALATION ?
What about Result ?
What can I query?
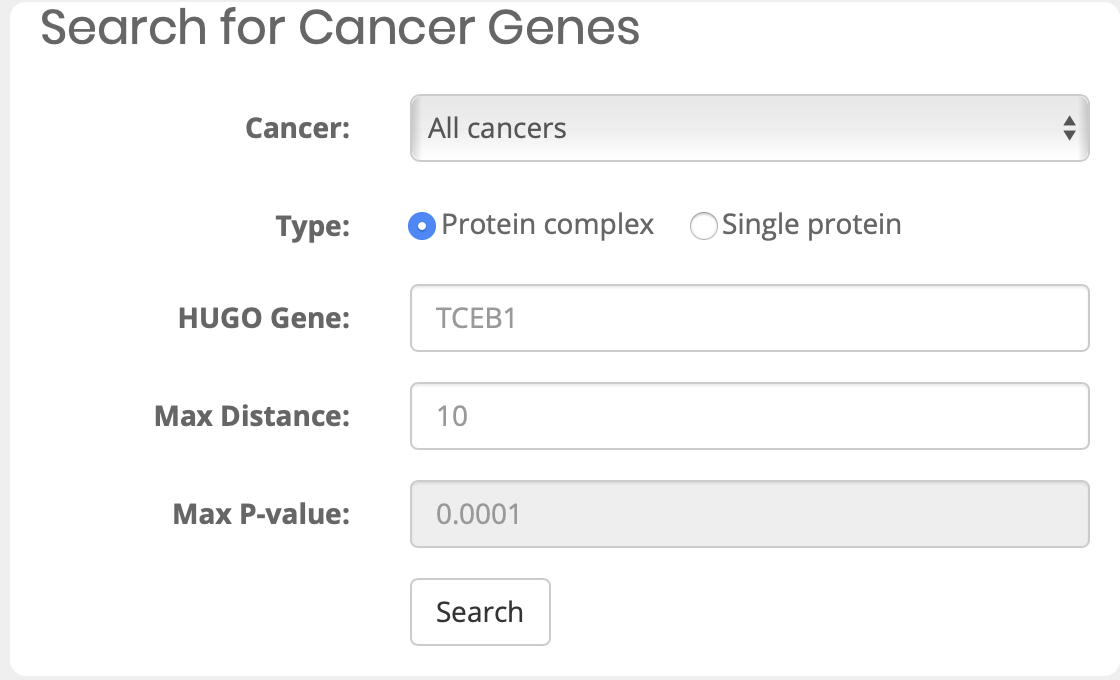
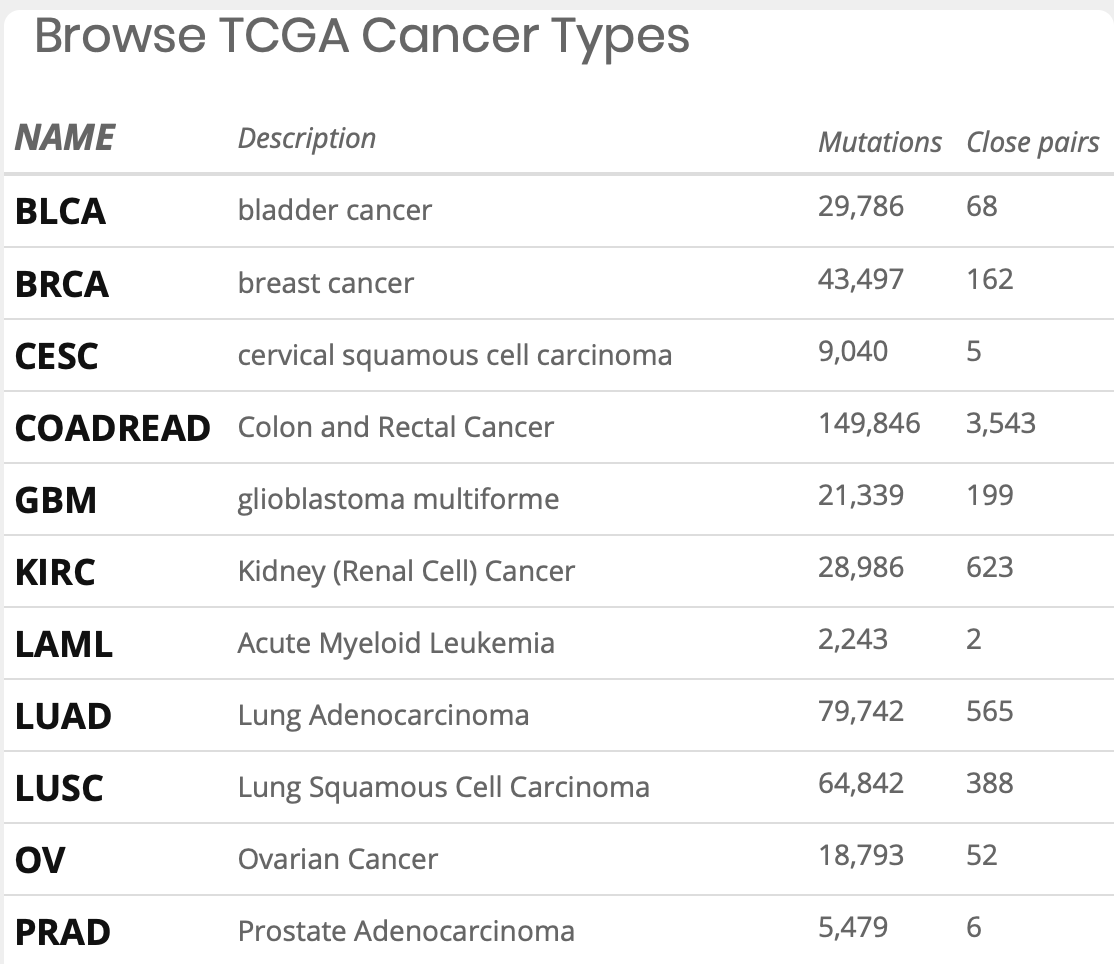
What is Mutation1 and Mutation2 after choosing cancer type?
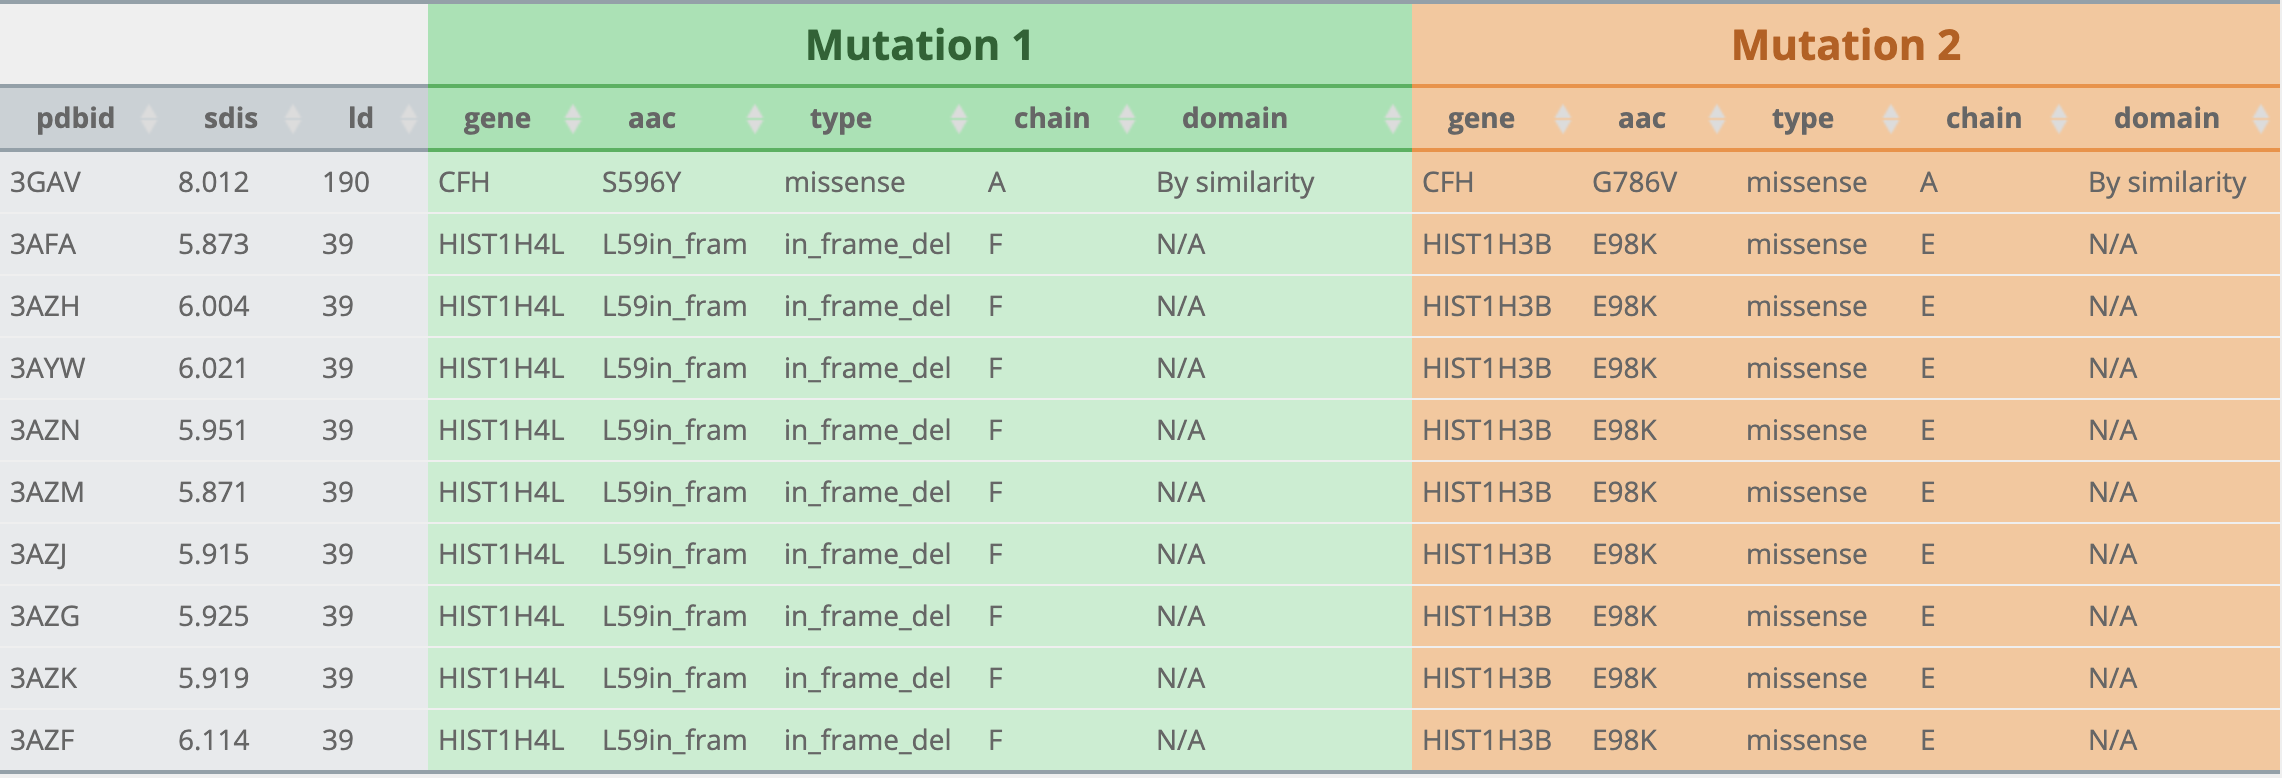
How to visualize after searching results?
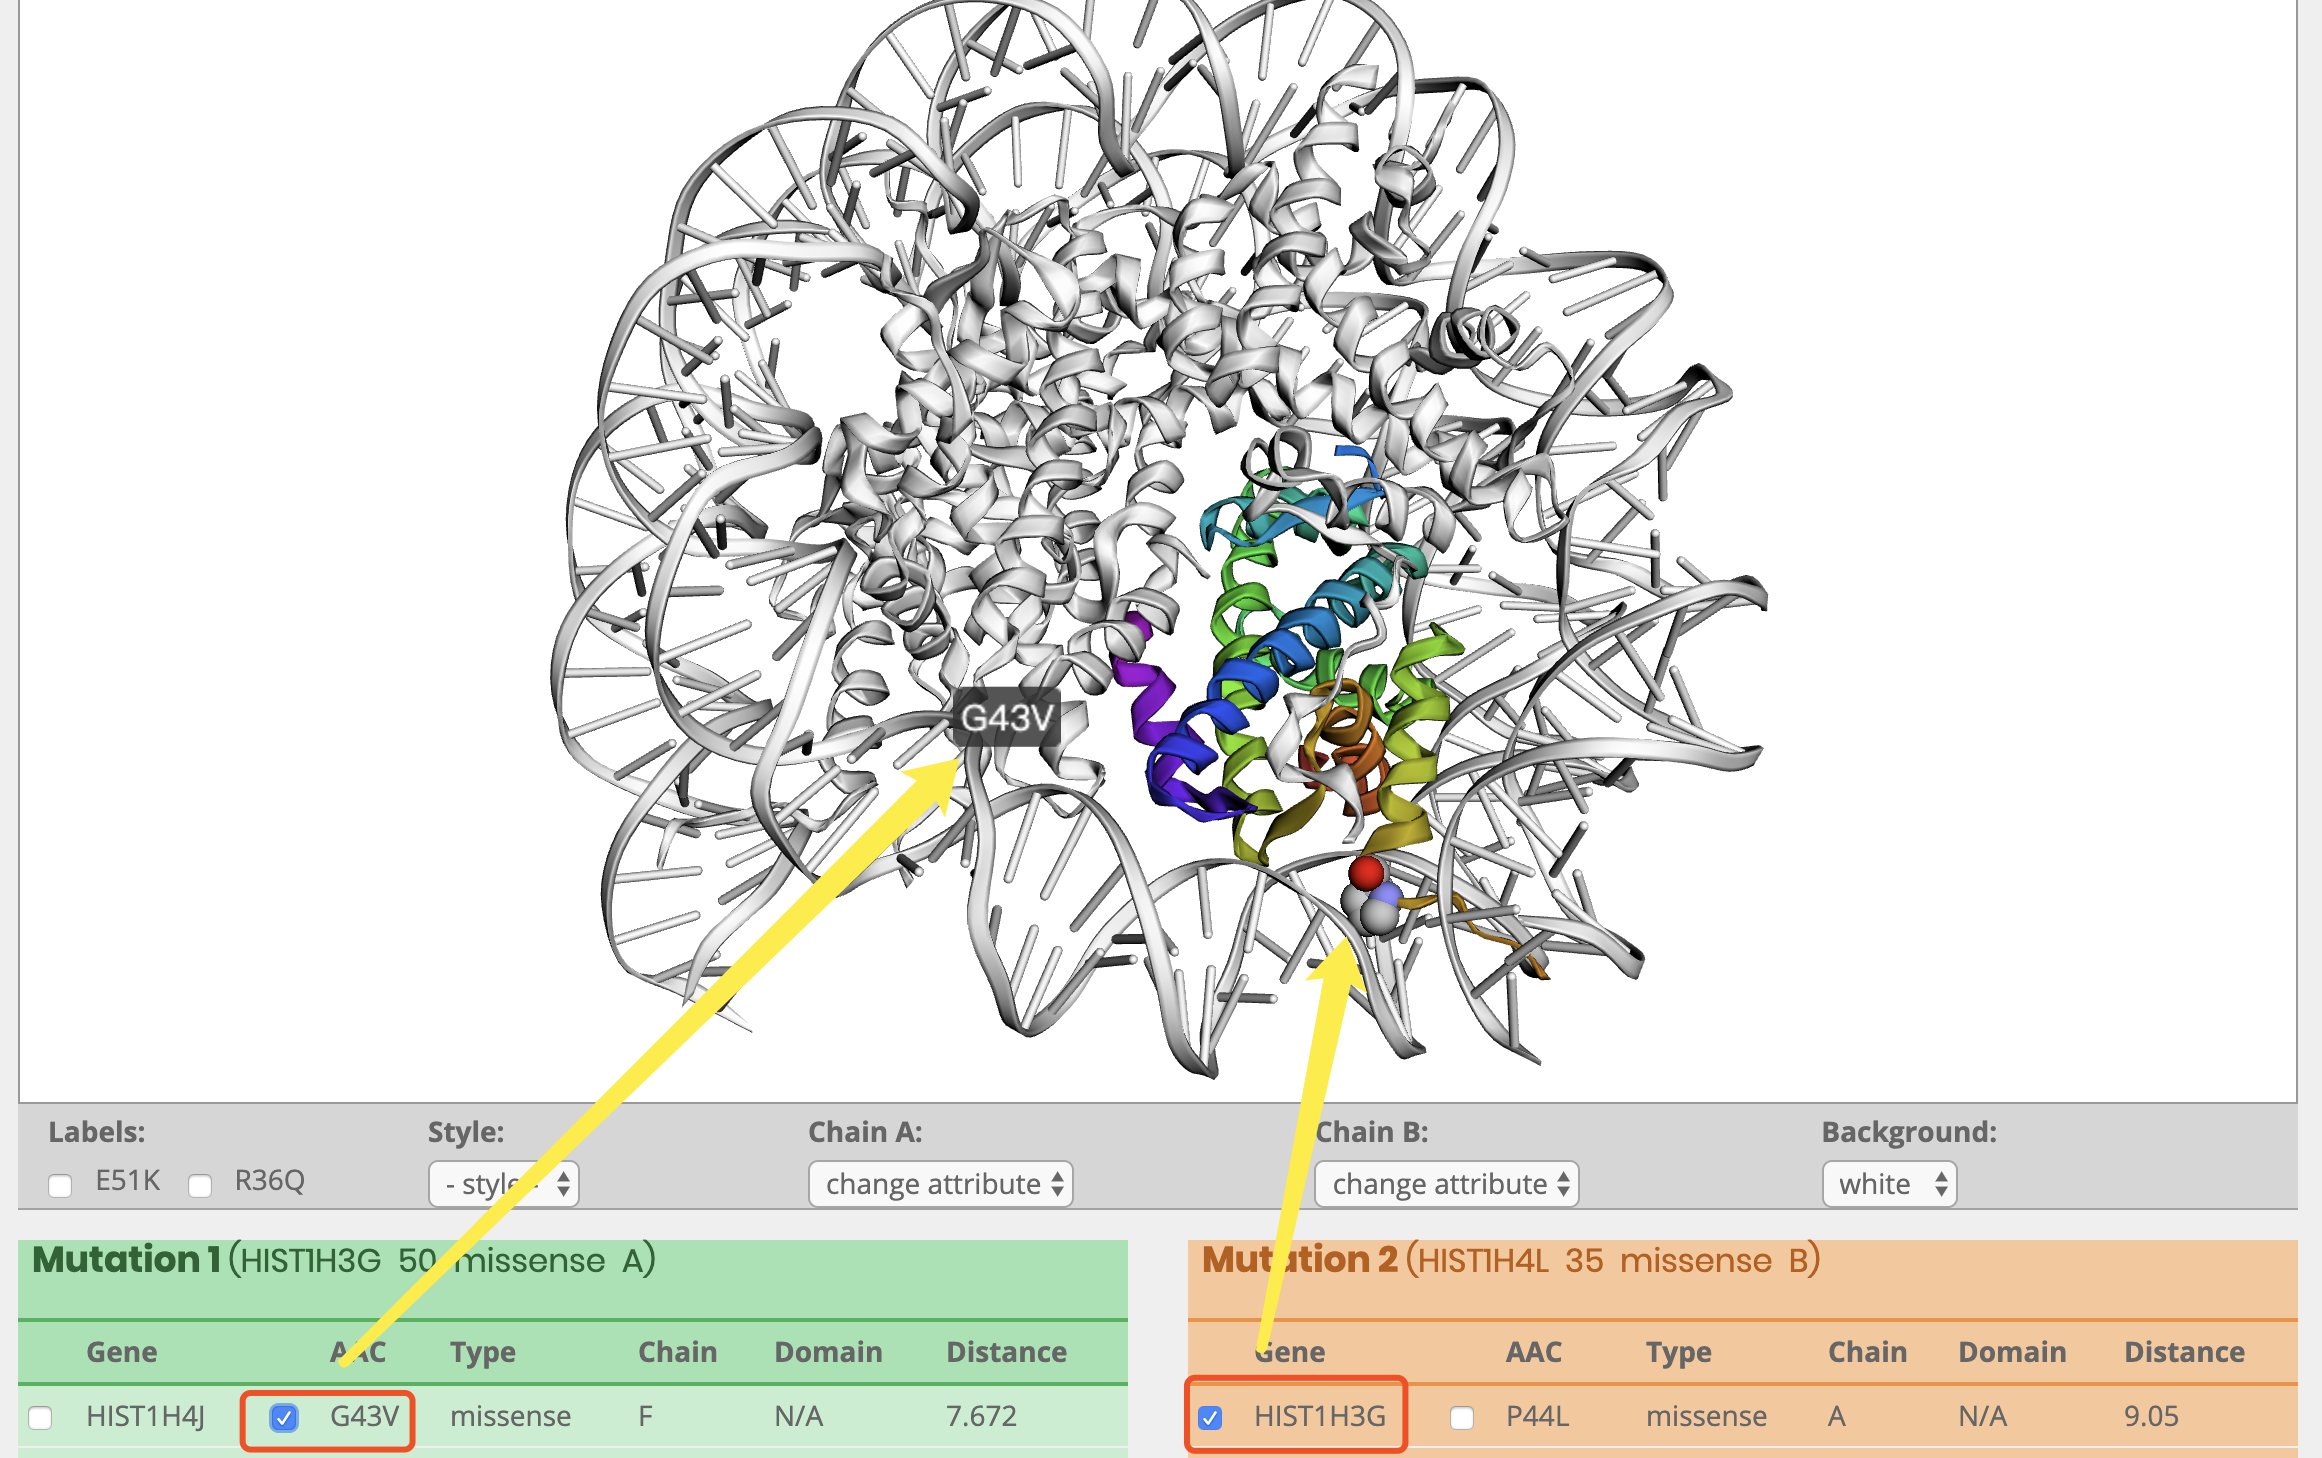
What information is included in the visual panel?
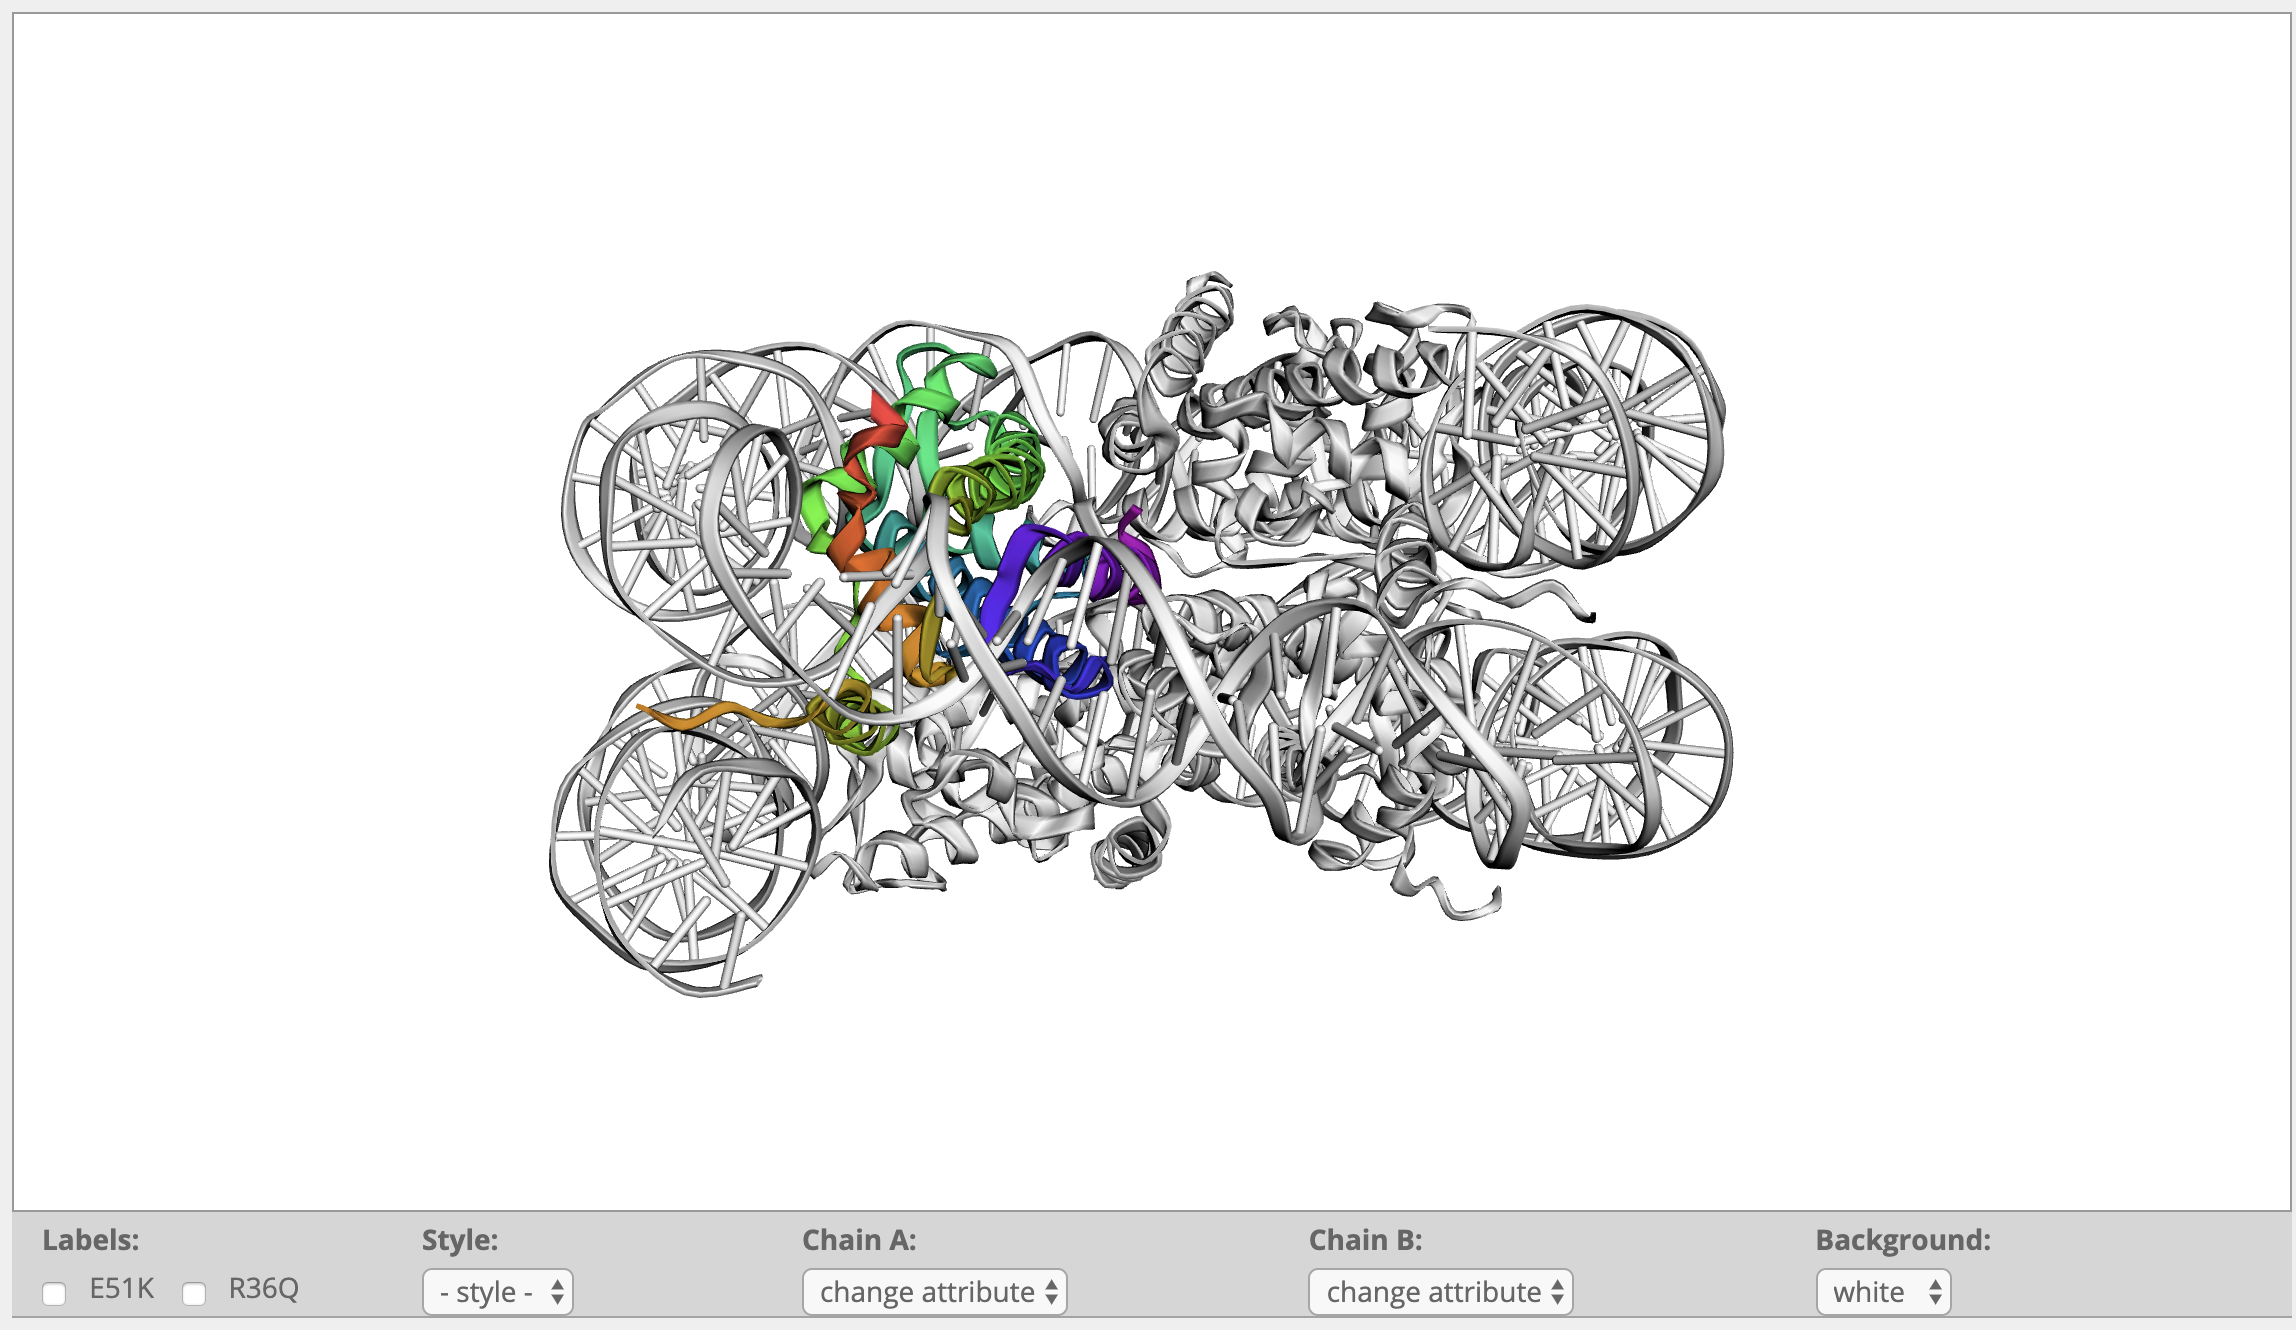
How to display clsuter and labels?
If you use HotSpot3D in your research, please quote
COMMERCIAL